
Automatic Correction of Inner Filter Effect
Labbot simplifies IFE correction since you can measure the full-spectrum absorbance of the sample at every point of measurement, allowing for continuous, automatic correction.

What is the inner filter effect?
The inner filter effect (IFE) is a loss of fluorescence intensity caused by absorption of light by the sample. The primary inner filter effect results from absorption of the excitation light. The secondary inner filter effect is caused by absorption of the emitted light.
For a more in-depth discussion of the inner filter effect, see our blog post: What is the Inner Filter Effect and How Does it Impact Fluorescence Measurements?
When do you need IFE correction?
The advice for avoiding the inner filter effect is typically to work at "low" concentrations, where the absorbance is low enough to not interfere with the fluorescence signal. More specific recommendations might mention numbers, such as staying below an absorbance of 0.1. It is worth noting that even at this low absorbance value, the error in fluorescence intensity can be as high as 10%. What counts as an acceptable error will, of course, depend on the application.
To be able to make these calls, it is necessary to be aware of the problem and to measure the absorbance of the sample, both in the beginning and end states.
While it may not always be strictly necessary to correct for the inner filter effect, doing so will always improve the accuracy of your measurements.
Labbot simplifies IFE correction since you can measure the full-spectrum absorbance of the sample at every point of measurement, allowing for continuous, automatic correction.
Any protocol relying on fluorescence measurements can be amended to include automatic inner filter effect correction by the following steps:
When designing the procedure:
- Add a virtual detector, set to absorbance. Make sure that the wavelength range covers both the excitation and emission wavelength.
When running the procedure:
- Make sure to use a clear blank (cuvette with water) during the ‘Prepare spectrometer’ step
- Go to the plot window, select a plot and press ‘Edit script’
- Edit the Y-axis script according to to this template:
Where $D_F$ is the virutal detector of your fluorescence measurment, $\lambda_F$ is the wavelength of the emission signal, $D_A$ is the virtual detector of your absorbance measurement and $\lambda_E$ is the excitation wavelength.
Next, we will turn to two specific examples.
Example: Concentration Dependance
This example serves to highlight the impact of the primary inner filter effect and the benefits of correction. We follow the fluorescence signal as we increase the concentration of pyranine dye. Without an inner filter effect we would expect the signal to increase linearly with the concentration, however, in reality it quickly deviates from linearity and levels off (figure).
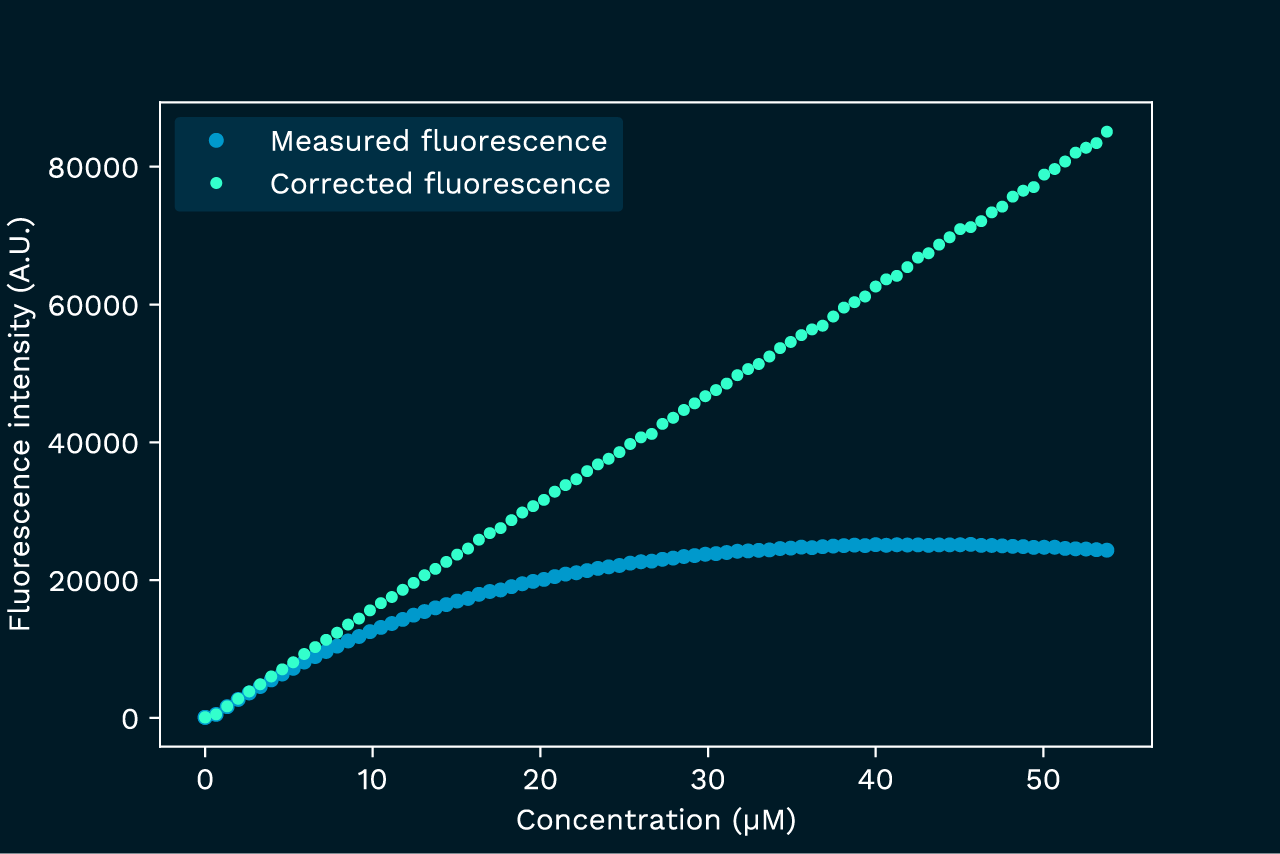
Applying the correction formula fully recovers linearity.
Detector 1: Absorbance
Detector 2: Fluorescence with excitation at 450 nm.
Y=[2,513]*10^([1,445:455]/2)
Example: pH-titration
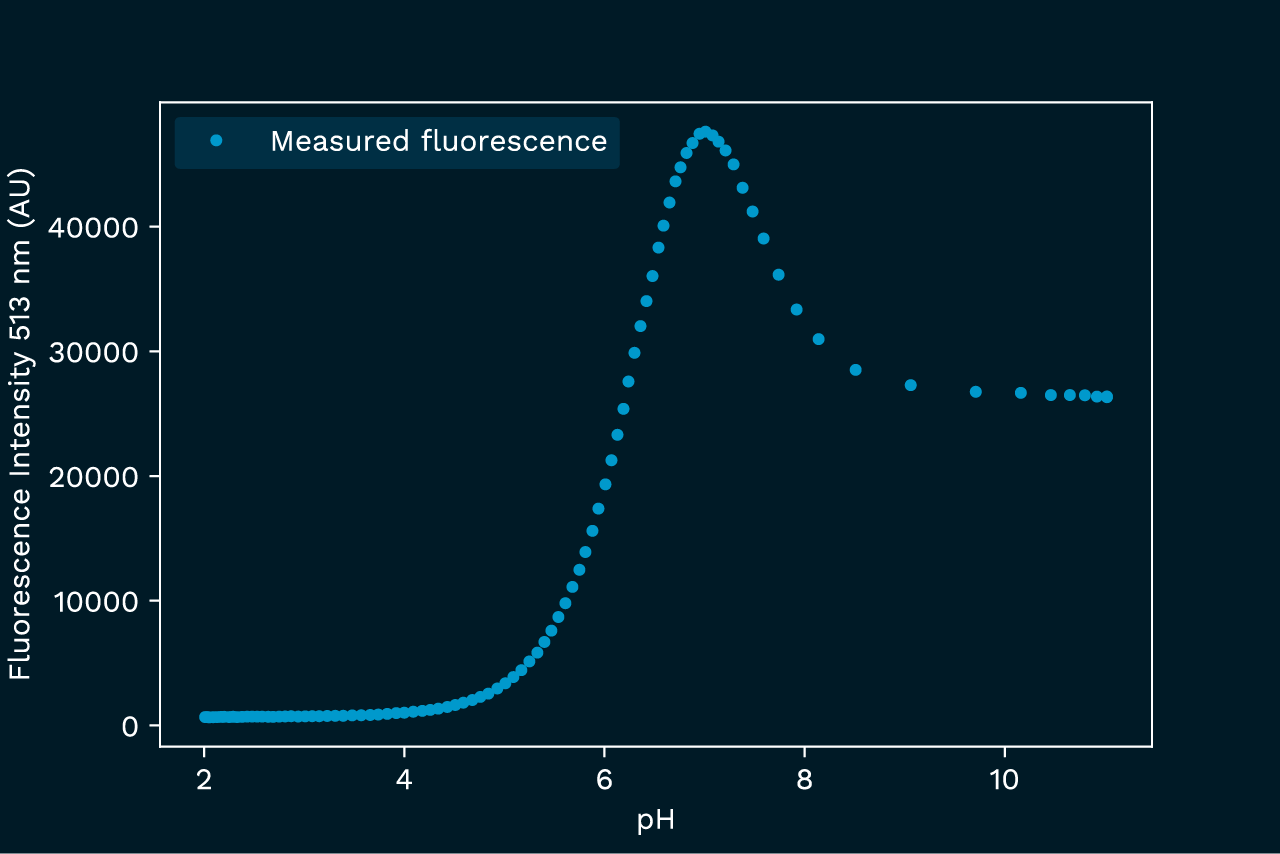
This example illustrates how the inner filter effect can distort the outcome of an experiment, hiding the real process. In this experiment we subject the pyranine dye to a pH titration, and follow the intensity of the 513 nm fluorescence peak. This peak is only observable in the deprotonated form of the pyranine, so we expect to see a classical titration curve. However, since the absorbance also varies across the pH span, the observed fluorescence has a more complex pH dependence, as shown in figure 2.
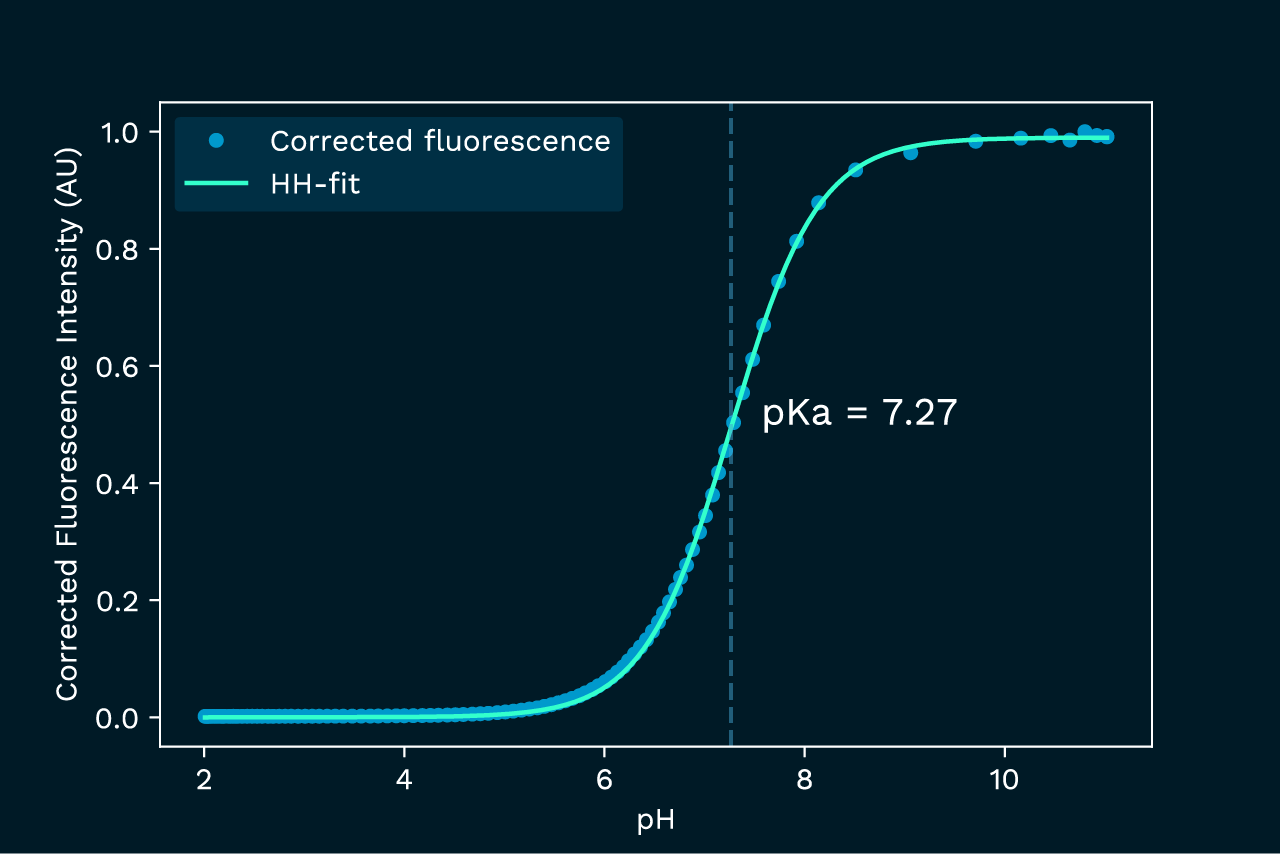
Once corrected for the inner filter effect, the data aligns with a standard titration curve, as shown in figure 3.
Benefits
Workflow


Data
Technical Note (PDF)
Fill in your e-mail below and we will send it over straight away.
Authors

Mattias Törnquist
Helping fellow scientists get the most out of their experiments with Labbot.